- Two different studies were done (using daily oral dosing) (with multiple update publications thru 2012**)
- July 2002 (E+P) WHI Estrogen plus Progestin Preliminary (Final Revised follow)
(Prempro conjugated equine estrogen 0.625mg/ medroxyprogesterone acetate 2.5mg)
- April 2004 (E) WHI Estrogen only
(Premarin conjugated equine estrogen 0.625mg)
- July 2002 (E+P) WHI Estrogen plus Progestin Preliminary (Final Revised follow)
- Both studies were stopped early
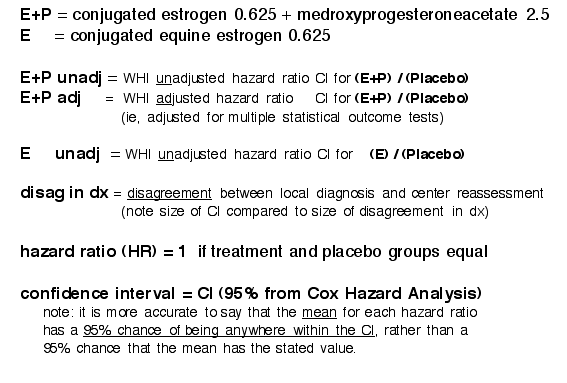
- Hazard Ratio is the Ratio of the Hazard Rates for each group, or the
[ outcome rate with hormone , divided by outcome rate without hormone ]- hazard rate is the ratio of # of events within the group to total # within the group, over a given time period
- hazard ratio is the ratio of hazard rates for group1 to group2 (it's a pure number), over the same time period, and with the same risks except for hormone
- hazard rate is the ratio of # of events within the group to total # within the group, over a given time period
- Hazard Ratio Significance
- Hazard Ratio = 1.0 is equal risk rates.[ (YELLOW) ] (ie, differences are likely due to chance)
- HR >1.0 is increased risk rate in hormone group [ (RED) ]
- HR <1.0 is decreased risk rate in hormone group [ (GREEN) ]
- [Author Note]
-The interpretation of a HR near 1.0 requires an estimate of the Error Bars for that HR.
-At a 5% level of significance for measures used in the ratio, a HR in the range
[HR=0.8 to HR=1.2] is equivalent to a HR=1.0 (differences are still likely due to chance).
-Many statisticians favor the HR be outside the range [HR=0.5 to HR=2.0]
or even [HR=0.3 to HR=3.0] to indicate a meaningful statistical difference.
- Confidence Interval (CI ) is the range of HR's likely to contain the mean HR
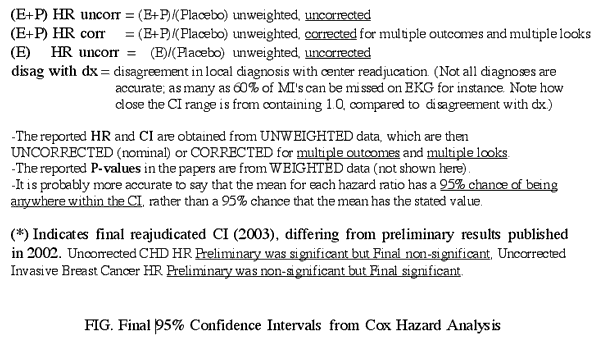
- it is more representative to say "the mean Hazard Ratio has a 95% chance of being somewhere in the CI interval", rather than "have a 95% chance that the HR for a given patient has the stated value". (**These cannot be distinguished in general and for nice (gaussian) distributions are equivalent statements).
- CI interval contains 1.0 if equal risk rates [ (YELLOW) ] (even if Hazard Ratio is different from 1.0, differences are likely due to chance)
- CI interval greater and excluding 1.0 is increased risk rate in hormone group [ (RED) ]
- CI interval less and excluding 1.0 is decreased
risk rate in hormone group [
(GREEN)
]
- The large number of dropouts and crossovers reduces the accuracy of outcome results, and mixes some exposure patients into the no exposure group (and the reverse) after randomization was completed.
- Adjustment for multiple testing and multiple outcomes
- (E+P) arm (2002, 2003) reported both unadjusted (uncorrected)
and adjusted (corrected) risk ratios
(for statistical testing over multiple times and over multiple outcomes) - (E) arm (2004) reported only unadjusted (uncorrected)
risk ratios
- (E+P) arm (2002, 2003) reported both unadjusted (uncorrected)
and adjusted (corrected) risk ratios
SubGroups Risks for CHD, Stroke, DVT, PE, BreastCA, ColonCA, HipFx, Global Index
|
|
||||||||||||||||||||
| (E+P Unadjusted) | ||||||||||||||||||||
| preliminary unadjusted result | final unadjusted result | |||||||||||||||||||
| -note CHD/BreastCA risk flips- | ||||||||||||||||||||
| (E+P HR) 2002 | (E+P HR) 2003 | |||||||||||||||||||
| CHD, Stroke, DVT, PE, Global Index | BreastCA , Stroke, DVT, PE, Global Index | |||||||||||||||||||
| higher risk than Placebo | ||||||||||||||||||||
|
same risk as Placebo (=)
|
BreastCA | CHD | ||||||||||||||||||
| ColonCA, HipFx | ||||||||||||||||||||
| lower risk than Placebo | ColonCA, HipFx | |||||||||||||||||||
| (note final risks for CHD/ BreastCA flip for unadjusted) | ||||||||||||||||||||
| (E+P Adjusted) | ||||||||||||||||||||
| (after adjustment for multiple statistical testing and multiple outcome effects) | ||||||||||||||||||||
| final adjusted | ||||||||||||||||||||
| preliminary adjusted | ||||||||||||||||||||
| (E+P HR) 2003 | ||||||||||||||||||||
| (E+P HR) 2002 | ||||||||||||||||||||
| higher risk than Placebo | DVT | DVT | ||||||||||||||||||
|
same risk as Placebo (=)
|
CHD, BreastCA, Stroke, PE, ColonCA, HipFx, Global Index |
CHD, BreastCA, Stroke, PE, ColonCA, HipFx, Global Index |
||||||||||||||||||
| (note preliminary and final results are the same for adjusted) | ||||||||||||||||||||
|
|
||||||||||||||
| (E-only Unadjusted) | ||||||||||||||
| unadjusted* | ||||||||||||||
| (E HR) 2004 | ||||||||||||||
| higher risk than Placebo | ||||||||||||||
| DVT, Stroke | ||||||||||||||
|
same risk as Placebo (=)
|
CHD, PE, Global Index, Colon Ca, (**BreastCA 2002 - 5.6 year) | |||||||||||||
| HipFx, **Breast Ca (2012 - 12 yr followup) | ||||||||||||||
| lower risk than Placebo | ||||||||||||||
| (*DVT and adjusted results were not reported for E-only trial
**12 year followup of Premarin only 2012 changed results for Breast Ca 2002) |
||||||||||||||
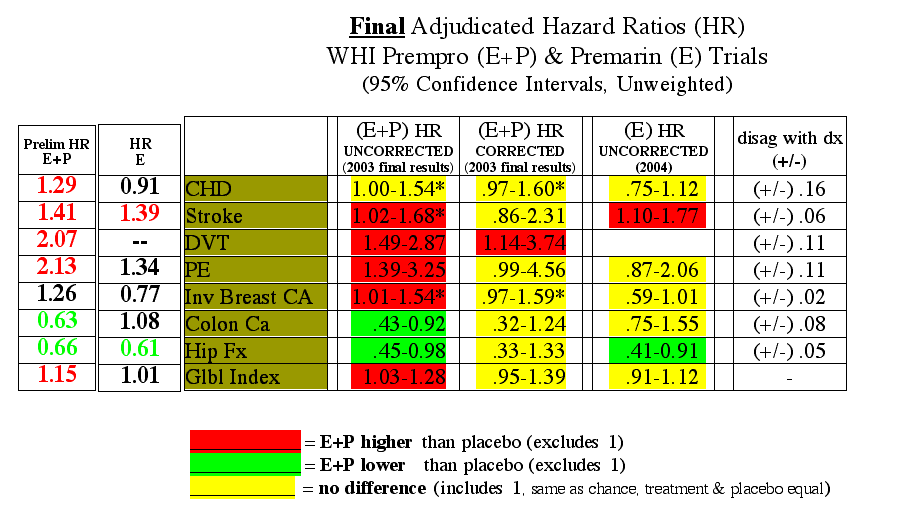
WHI SubGroup: Hazard Ratio Confidence Interval Ranges


In particular the the final vs preliminary CHD and Invasive Breast Cancer results flipped
[clic on table below to open it in separate window to compare to Preliminary results]
Final Adjudicated Table2: (2003/E+P, 2004/E-only)
WHI SubGroup: Hazard Ratio Confidence Interval Ranges
(shown with Mean HR to left)

