Survival Analysis (Proportional Hazard Model) combines elements of Experimental and Observational studies with randomization to treatment group. The recent Estrogen and Progestin Trials ( JAMA 2017, 318(10): 927-938)1 is an 18 year observational follow-up of one such clinical study ( JAMA , July 17, 2002, 288(3):321-333)2. Hormones after menopause had no increased harms according to the update, reversing the original findings. A Linear Regression supported a decreasing Mortality Rate of -3.9/10,000 each additional year on hormone (Menopause 2004;11(6):664(P-43)). Regression informs the data sets, suggests a more restrictive Hypothesis Test at p<=0.01 for Risk Ratios, and the use of Confidence Intervals to achieve more reliable interpretations.
An ongoing walk back of all Women's Health Initiative Studies (2002-2017) findings has occurred:
-
2002
-
Randomized Intention to treat
Clinical Trial [
CEE
+
MPA
] :
I. "Overall health risks exceeded benefits from use of combined estrogen plus progestin for an average of 5.2 year follow-up among healthy postmenopausal US women." 2
II. Menopausal women were warned to stop their hormones based on the highly-publicized findings of the WHI 2002 and subsequent papers. The use of estrogen-only therapy in U.S. women aged 50 to 59 declined nearly 79 percent between 2001 and 2011 . It is estimated during that time, at least 18,000 excess deaths occurred because of estrogen avoidance and possibly more than 91,000." 5
-
2017
- 18 year
Observational follow-up
[
CEE
or
CEE
+
MPA
]
1
:
I. " hormone therapy with CEE plus MPA for a median of 5.6 years or with CEE alone for a median of 7.2 years was not associated with risk of all-cause, cardiovascular, or cancer mortality during a cumulative follow-up of 18 years. "
II. Peri-menopausal Women (50-59 years) who took [ CEE plus MPA ] showed a Decreased Mortality when compared to Post-menopausal Women (70-79 years) in both periods.
1) Ratio = 0.61[0.43-0.87] (5 year CEE + MPA hormone - intervention phase)
2) Ratio = 0.87[0.76-1.00] (5 year intervention plus 13 year post hormone)
-
In any regression
or time series analysis, it is important to consider both systematic and stochastic errors. Hazard Ratios are measures of association widely used in prospective studies, "comparing the hazard function among exposed to the hazard function among non-exposed... a hazard ratio of 1 means lack of association, a hazard ratio greater than 1 suggests an increased risk, and a hazard ratio below 1 suggests a smaller risk."
6
-
In the Proportional Hazard Ratio Model
(Cox)
WHI
Prempro
studies, a ratio is reported for the [event rate(numerator y)] to [time-to-event rate(denominator x)] during each time period (year-t) comparing the Hormone(treatment) and Placebo(control) groups:
HR(annualized) = Avg(year-t) = Avg[ EP (year-t) / PL(year-t) ]
-
This obligates:
1) The [HR(year-t)] are constant and randomly distributed over the study.
2) The Deviations in [HR(year-t)] are also randomly (normally) distributed.
-
Some of the biases
in the Survival Analysis data have been identified and informed by the Mortality Difference
3
:
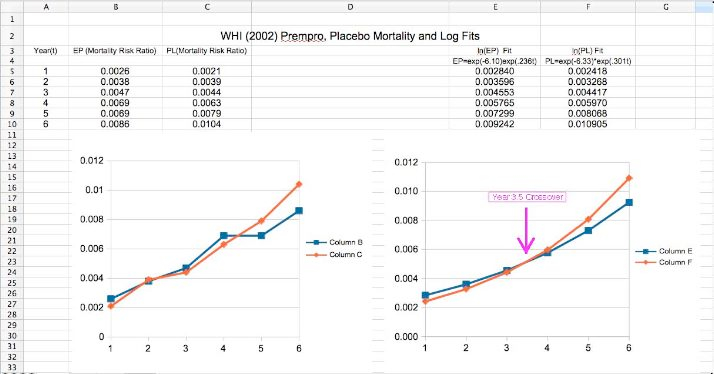
1) Both Group Rates (exposed/unexposed) increase over time in an exponential fashion. This is usually treated statistically by evaluation of the ln [HR] rather than the HR itself, which is linear for an exponential. However, this does not guarantee that the Deviations in HR are randomly distributed.
2) The form of the Hazard Function allows adjustment for patients who leave the study. For instance, un-blinding due to uterine bleeding dropped them out of the Study, and are called "Censored" patients. These would not be counted for a Heart Attack which occurred after the Censoring date.
3)Because the event rates are low, ln [HR] is well approximated by HR. That is, log[exp(t)] is proportional to t, and differences in the ln [HR(t)] are well approximated by differences in [HR( EP-t )-HR(PL-t)].
4) Events identified locally were not confirmed on central adjudication. The 2002 paper published a diagnosis error of (-16%) for MI, (-11%) for PE, (-16%) for DVTs , (-18%) for Cause of Death. When difference in event rates is small, or introduces Group and Time correlation, significance is eroded.
5) Statistical analysis of groups as equal, different, superior, or inferior are not equivalent. This creates confusion in demonstrating Significance.
6) In a multi-Outcome study, Treatment may affect other Outcomes, or introduce a time correlation by advancing or delaying diagnosis. Provera in women is known to alter EKG findings such as noted in Printzmetal's Angina, and so alters diagnosis.
7) The WHI was a carefully constructed multicenter study, patients were randomized at the time of entry into the study. There was up to a six month delay before Hormone/ Placebo) was actually started. For any given year, some patients have less than a full year of treatment compared to control patients who had no treatment for that whole year (no hormone is the same as placebo treatment). Events in a given year are assumed to be randomly distributed throughout the year as having occurred in the midpoint of the year. [Time-to-event] is calculated from entry into the study, not the actual date that hormone treatment begins.
-
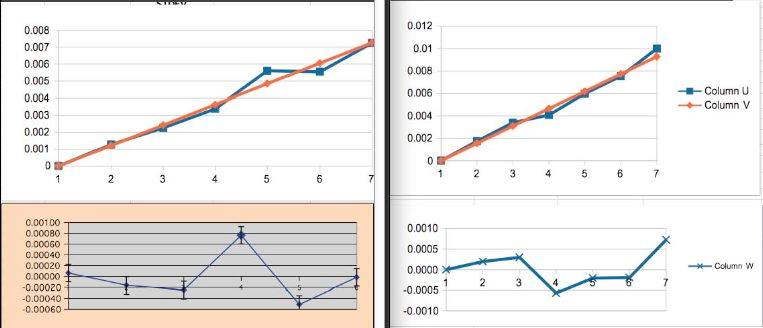
The 2002
WHI
paper
reported a constant Hazard Ratio of HR=
EP
(Hormone)/PL(Placebo) = 0.98. This produces the following when graphed. It can be seen that the values are not really symmetric about a constant HR = 0.98 as would be expected.
Group has a Year0 bias.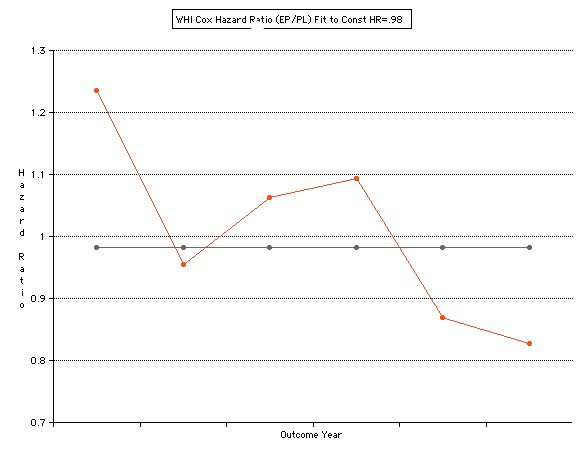
-
Note that there is a crossover at 3.5 years. This is not only a violation of the constant HR assumption, but indicates possible mid-study change (change in sign). Effects of Hormone could be time dependent or there were changes in the Group.
-
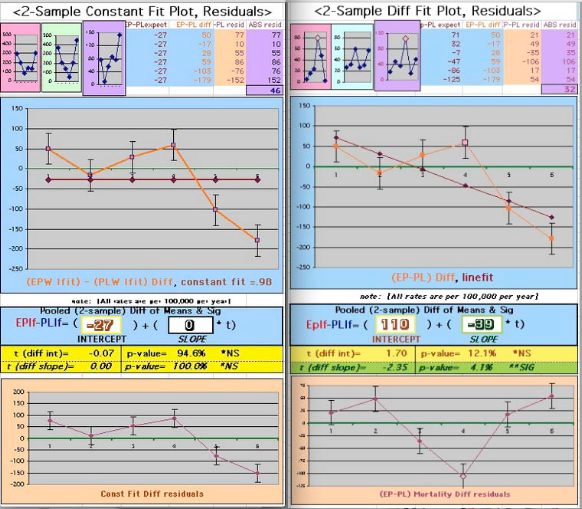
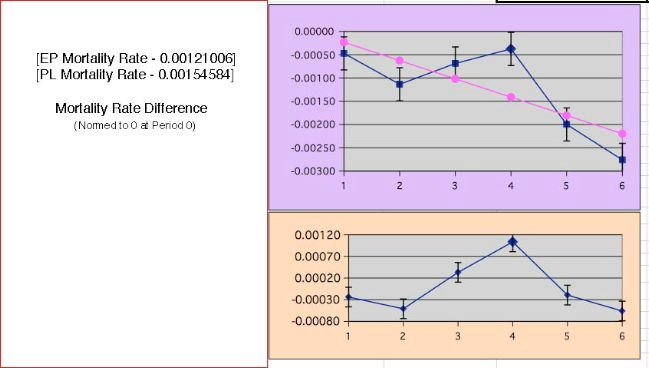
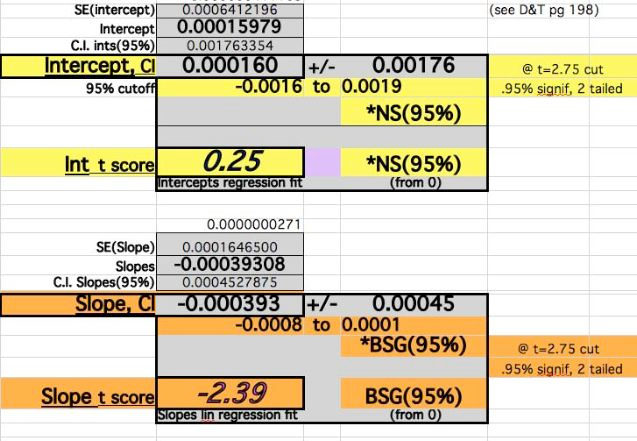
This produces a Mortality Rate Difference which is monotonic decreasing from 0:
-
The error in the Slope Difference improves by this and approaches significance:

-
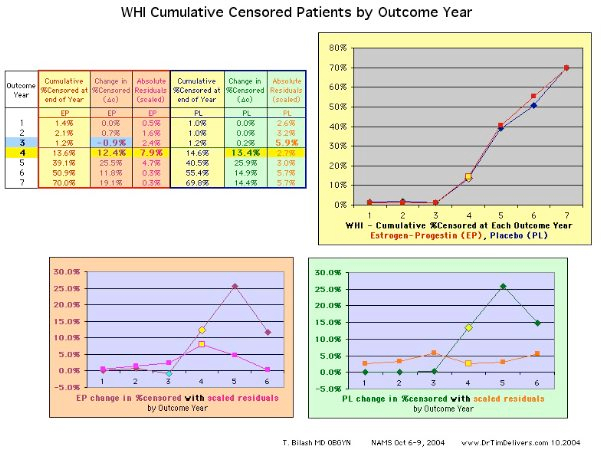
Survival Analysis requires
unblinding
and removal from the study (Censoring). There was a clear jump in censored patients at year 3-4 for reasons. Censoring that removes patients who have not had the identified event yet, would remove the future event and decrease the event rate.
-
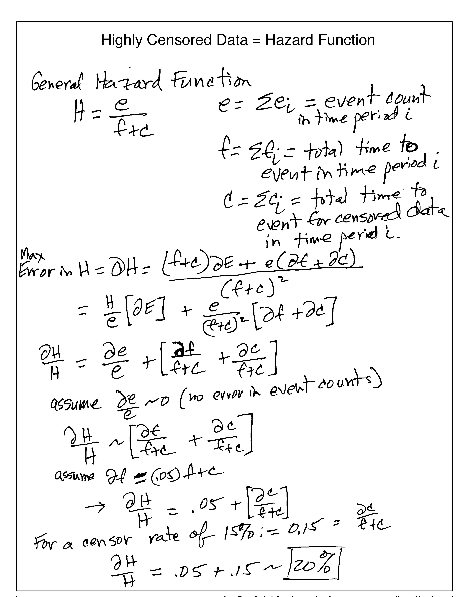
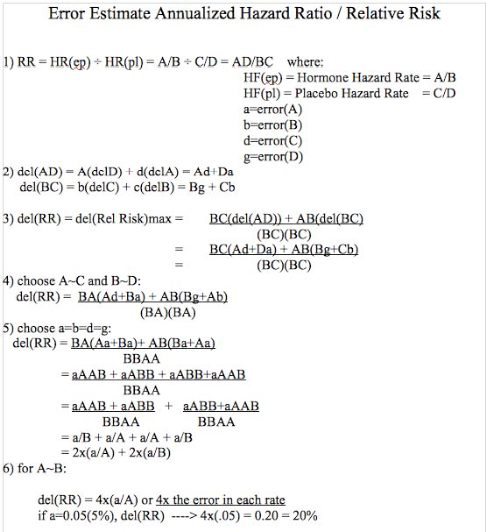
The way these are handled is in the Hazard Function,
H = e/(f+c)
where e=Sum(
ei
) event counts for the period i, f=Sum(time to event) for the period i, and c=Sum(time to censored event) for the period i. As noted there was a 15% censor rate in Year4. The expected error in the Hazard function in Year4 is larger than expected. A simple estimate indicates that for a [15%] censor rate one might expect up to a [20%] combined error for the Hazard Rate when data is collected at the a 5% level, 4x the error for each component the usually used in Lab and data evaluations.
-
Quantities being determined are Rates and Ratios of Numbers, not Numbers. An estimate of errors in the Annualized Hazard Ratio as the ratio of Hazard Rates would thus have multiplicative 4x error estimation.
-
Similar results are obtained when considering Confidence Intervals for the Error in a Ratio
6
:
-
For R the Ratio of two numbers with errors:
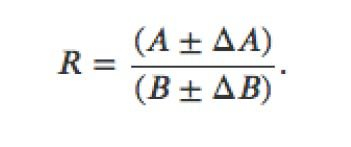
-
The Confidence Interval becomes:
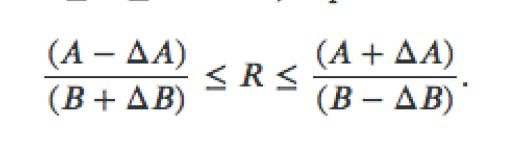
-
Choose
DeltaA
=
DeltaB
= 0.05 (5%) to calculate simple Confidence Interval:
(A-.05A)/(B+.05B) <R< (A+.05A)/(B-.05B)
(.95/1.05)A/B < R < (1.05/.95)A/B
[0.90]A/B <R=A/B<[1.11]A/B
- So, the error in a ratio A/B is ~2x the error in A,B (0.1 for 0.05,0.05)
-
The Hazard Ratio is a Ratio of Rates, so estimating the overall error becomes ~
4x
the error l
evel
chosen.
-
For R the Ratio of two numbers with errors:
-
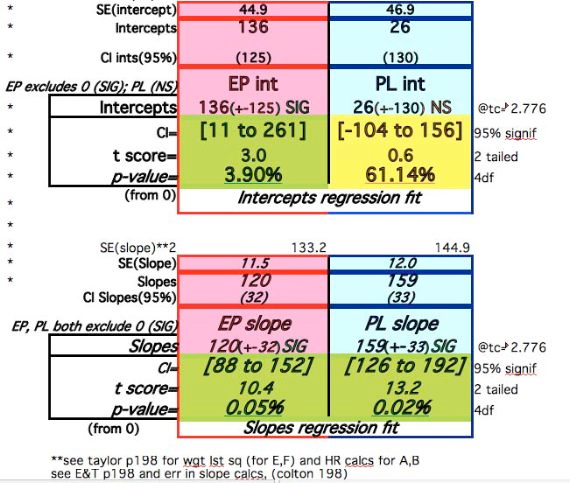
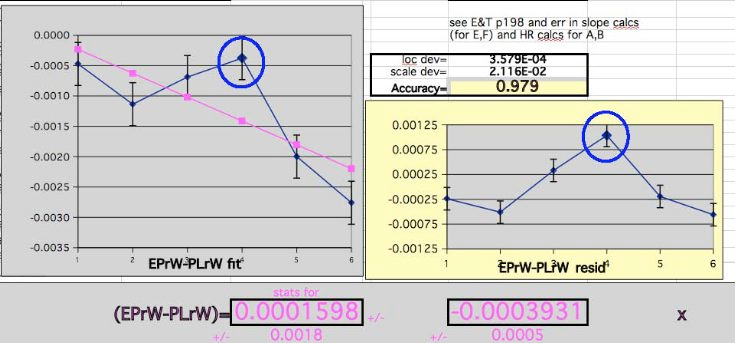
The Regression Fit T-Score for the Slope becomes nearly Significant at the 95% level.
-
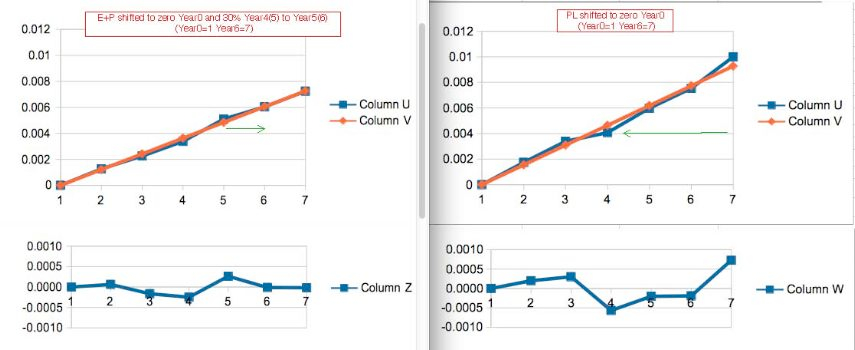
As an exercise the regression shifted 30% of the Year4 Rate into Year5 in the
EP
Hormone Group:
-
Note the improvement in Year4(5) Residual. Note also the indications that some Mortality in the Placebo Group were delayed, or Censored later compared to the Average Mortality Events (bigger denominator in each year).
-
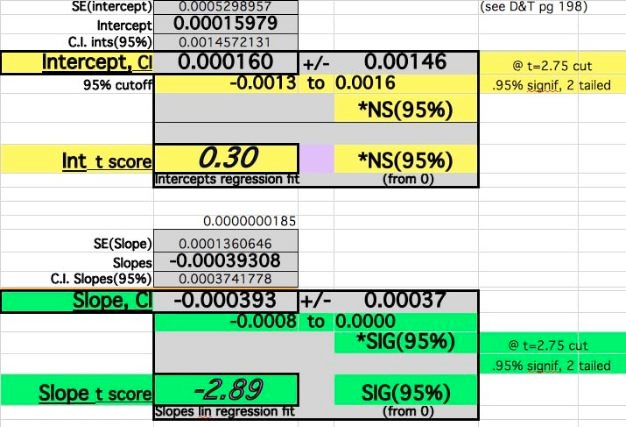
The Regression Fit T-Score for the Slope becomes Significant at the 95% level with these adjustments:
-
Despite the adjustments of 0 events at time 0 and Year4 adjustments, the Slope fit does not vary widely (39-45/100,000). The Year0 errors dominate the Intercept Difference, Year6 dominates the Slope value, and the middle Year values are less
senstive
to both but contributes to the statistical significance.
-
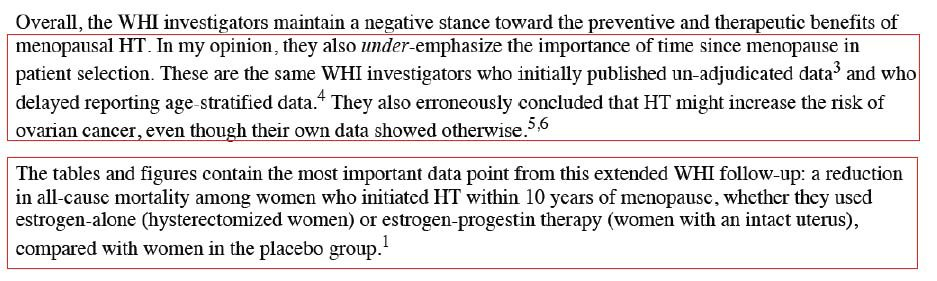
A comprehensive explanation of where the
WHI
has taken us appeared in an online news site
1
-
It is telling that the
WHI
Authors rejected evaluations indicating the need for age stratification. The data was not released until 2 years after the publication of the 2002 paper. It is now clear that younger
Perimenopausal
women respond differently to the presence or absence of Hormone, and non-stratification by age injected heterogeneity.
-
Pleas of Clinicians like Holly
Thacker
, MD, went
unheaded
over a 15 year period:
11
-
Patricia T. Kelly, PhD in 2003 suggested the following criteria for
Epidemiologic
Studies (which she argued includes these Intention-to-treat studies Survival Studies):
- want hazard ratio of three or greater. In the WHO, the hazard rates was far less than three, suggesting that factors other than Prempro (Estrogen plus Progestin ) may be responsible.
- want statistically significant difference between study and control group. Statistical significance was not obtained in the WHI .
-
want similar findings in other studies. Another large randomized prospective study,and many retrospective studies did not agree with the
WHI
.
-
Exploratory studies are very important in Medicine, but a large number of large study reversals indicates problems with the statistics. The
heterogeniety
over time and the averaging over different Years assumes there is no change to the cohorts as time goes on. Announcements that treatment is dangerous may be a factor. Discontinuities over time, and excess risk in the treatment group for the
WHI
should have given pause to global recommendations. Overall p-values (p<0.01, 1/4 times the value customarily used for number statistics), or Confidence Intervals (RR >1.5, providing a 4x cushion) might be a reasonable start.
-
A recent paper explored the issue of P-values and
CI
for Relative Risk.
14
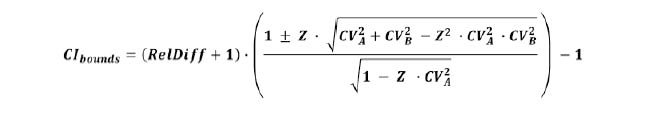
- "despite the apparently ubiquitous inferences about percent change and relative differences there are very few sources that mention how one can calculate the standardized error or confidence interval bounds for such a statistic."
- "there are two factors that affect how badly the naive extrapolation from absolute to relative difference will perform: the size of the true relative difference , and the confidence level ."
- "there is no simple correspondence between a p-value or confidence interval calculated for absolute difference and relative difference (between proportions or means)."
- "I am not aware of a straightforward way for calculating a p-value based on the same approach used to calculate this confidence interval. A p-value calculated with the standard error approximation from the Delta method will be far too conservative"
-
"the issue is not researched enough. The p-value calculation is iterative approximation, there is no analytical solution (formula) we know of"
We should return to "Physiologic Replacement of Hormones" ( PRH ) for Menopause. 13
Show your work, look at the data graphs, cross-check your results.
It should make sense.
This work is dedicated to my undergraduate mentor, Akira Inomata PhD, a brilliant Theoretical Physicist and life-long friend. In addition to his craft, he demonstrates a purpose of will that supports, nurtures and defends both experts and students alike. As he explores Physics, he contributes to Academic, Cultural and Humanitarian causes through his personal engagement.
March 05, 2019